
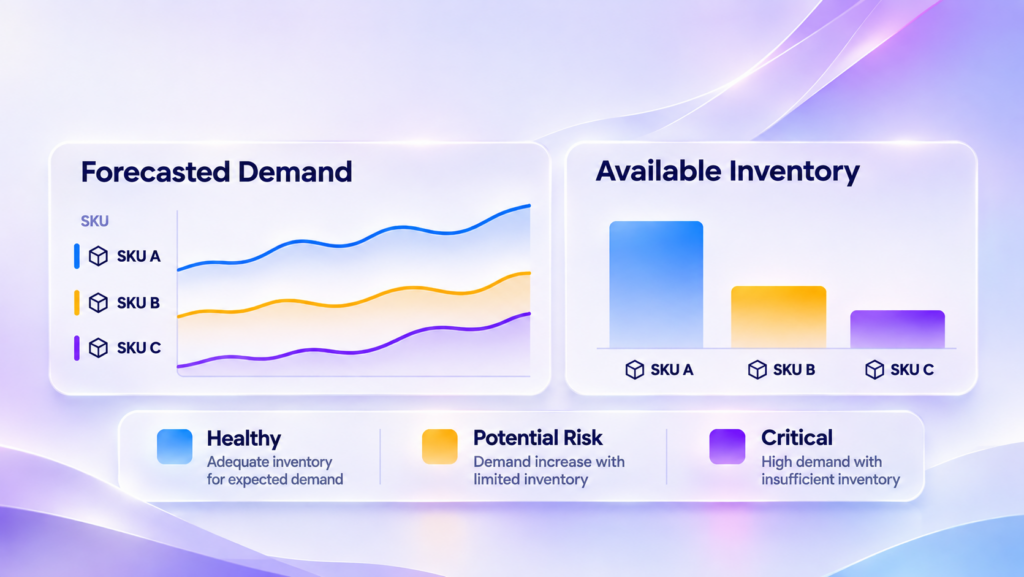
A demand planner working across hundreds of products and multiple stores may have thousands of updated forecasts to review each morning. Some will point to growing demand, others to a slowdown, and a few may suggest that available inventory is becoming misaligned with what customers are expected to buy.
The difficulty is deciding which of these changes deserve attention, particularly when normal variations in demand can look similar to the early signs of a more serious inventory problem. A forecast provides an estimate of what may happen, but interpreting its operational significance requires information about stock levels, historical patterns and the conditions under which a potential shortage or surplus might develop.
Predictive inventory alerts address this challenge by connecting demand forecasts with inventory risk indicators, helping planning teams distinguish routine fluctuations from conditions worth investigating. Their value depends on the quality of the underlying predictions, but equally on how reliably those predictions are translated into warnings that planners can understand and use.
Why More Demand Forecasts Do Not Always Mean Better Visibility
Forecasting at the SKU–store level gives retailers a detailed view of expected demand, allowing them to examine differences between individual products, locations and planning periods. As the number of forecasts increases, however, the amount of information requiring interpretation can become difficult to manage, especially when monitoring systems highlight every deviation from an expected value.
Consider a product whose forecast rises during a planned promotion and another whose expected demand increases while the store is already carrying limited inventory. Both may show a similar change in predicted sales, but the second situation could have more immediate consequences for availability if replenishment cannot keep pace.
The size of a forecast deviation therefore tells only part of the story, because its importance depends on the surrounding operating conditions. Seasonal patterns, promotions, current inventory and expected demand all influence whether an unusual observation signals a genuine concern or simply reflects normal business activity.
For planning teams, the challenge is to make this context visible without examining every forecast individually, using additional diagnostic information to identify where closer investigation may be justified.
Connecting Demand Forecasts to Inventory Risk
A September 2026 study by Gao Huan and Mohammad-Ali Sarvghadi, published in Information, examines how demand forecasting can be combined with inventory indicators to produce interpretable assessments of inventory health.
The researchers worked with approximately 500,000 product–store–day observations from a Chinese e-commerce company, comparing six forecasting models across statistical, machine learning and deep learning approaches. LSTM achieved the lowest testing RMSE and MAPE, while Random Forest and XGBoost performed more favorably according to MASE, showing that the relative performance of forecasting methods depends on the evaluation criterion.
Rather than stopping at model accuracy, the authors added a diagnostic layer that examines predicted demand alongside two inventory measures: Excess Inventory Rate (EIR) and an inventory-to-cost-of-goods-sold ratio described in the paper as Inventory Turnover Ratio (ITR).
These indicators are used to classify inventory conditions into three states: Healthy, Potential Risk and Critical. Instead of presenting demand forecasts as isolated numerical outputs, the framework provides a structured interpretation of how predicted demand relates to inventory conditions.
This is a useful development for demand planning because the same forecast can carry different implications depending on available stock. Nevertheless, a diagnostic classification should not be mistaken for a validated operational alert, since deciding whether a planner needs to be notified introduces further questions about reliability, urgency and usefulness.
Why Inventory Risk Thresholds Need to Reflect Historical Events
A monitoring system needs criteria for deciding when an inventory condition becomes unusual enough to deserve attention, but selecting those criteria is not straightforward. A threshold set too low can classify ordinary variation as problematic, whereas a more restrictive boundary may fail to identify risks early enough to support an effective response.
Huan and Sarvghadi approached this problem by examining historical stockout events and using the behavior of inventory indicators before those events to calibrate their diagnostic thresholds. Their methodology considered observations from the three days preceding a stockout as a potential warning period, with thresholds developed using earlier data and subsequently applied to a separate validation period.
The choice of a three-day window was specific to the research design and should not be interpreted as an optimal lead time for every retailer. In practice, a useful warning horizon will depend on factors such as replenishment lead times, product characteristics and the ability of planning teams to respond before an inventory imbalance becomes more consequential.
The researchers also examined how the classifications changed when the diagnostic thresholds were adjusted by 10% in either direction. The overall distribution of inventory health states remained relatively stable, indicating that modest changes to the boundaries did not substantially alter the proportion of observations assigned to each category.
That finding supports the consistency of the classifications within the analyzed dataset, although it does not establish whether individual risk signals correctly anticipate subsequent inventory problems. A threshold can produce stable results without necessarily providing the level of warning accuracy or advance notice required for operational use.
When Inventory Risk Signals Become Too Numerous
During the study’s independent diagnostic validation period, the framework classified 38.9% of SKU–store observations as Healthy, 44.8% as Potential Risk and 16.3% as Critical. Together, the two risk-related categories represented 61.1% of the observations analyzed.
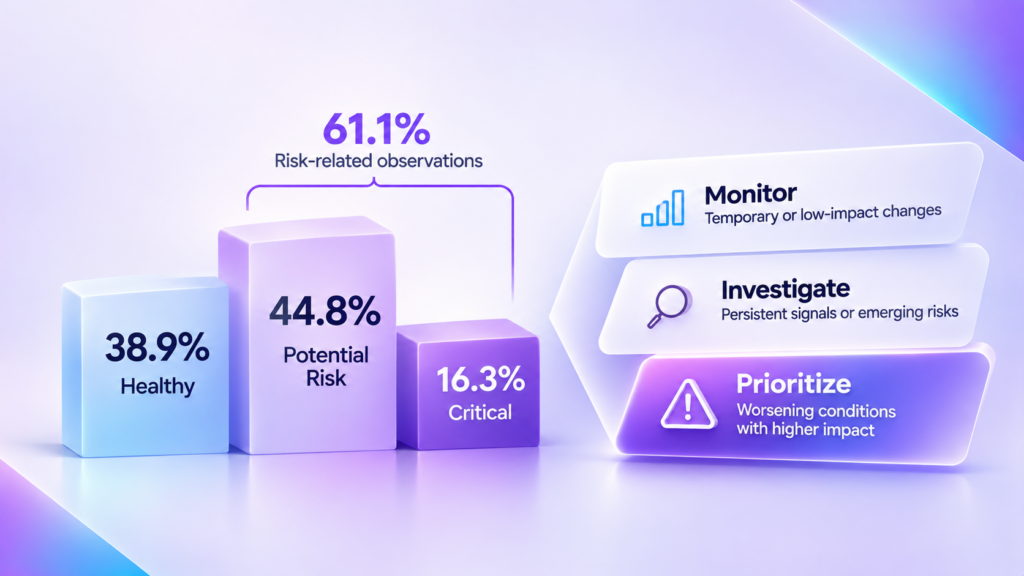
These figures describe the distribution of inventory health classifications, rather than the number of notifications delivered to planners or the proportion of confirmed stockouts and overstock events. The research did not test how employees responded to the classifications through a live alerting system.
Nevertheless, the distribution raises an important question for organizations considering predictive inventory monitoring. If a large share of product–store observations receives some form of risk classification, presenting every one of them as an immediate warning could make it difficult for planning teams to identify which conditions require attention first.
The problem is not necessarily the number of risks identified, but the way that information reaches the people expected to interpret it. Repeated notifications about minor fluctuations, conditions that resolve quickly or multiple observations of the same underlying problem could create unnecessary monitoring work without improving the planner’s understanding of what is happening.
This is where alert fatigue becomes a relevant design consideration, although the study itself does not measure that phenomenon. A practical monitoring process may need to distinguish between information suitable for a dashboard, conditions requiring closer observation and warnings that justify a more immediate review.
Persistence and severity can help inform that distinction, alongside the reliability of the underlying signal and the time available for a response. For example, a temporary change in an inventory indicator might remain visible for monitoring, while a worsening condition observed across successive periods could warrant a more prominent warning.
Such decisions would need to be evaluated in the retailer’s own operating environment. The aim would be to make risk information easier to interpret without suppressing warnings that could provide meaningful advance notice.
How to Evaluate the Quality of Predictive Inventory Alerts
A reliable demand forecast does not automatically produce a reliable inventory alert, because the rules used to interpret forecast outputs can introduce errors of their own. Even when predicted demand is reasonably accurate, a warning may be triggered too frequently, fail to detect a developing problem or arrive too late for the planning team to respond.
Assessing an alerting approach therefore requires more than comparing forecasting error metrics. Retailers need to examine whether the warnings correspond to relevant inventory events, how often important conditions are missed and whether planners receive enough advance notice to investigate a possible shortage or surplus.
False positives can increase the time spent reviewing conditions that do not develop into meaningful operational problems, while false negatives can leave planners unaware of risks that eventually affect availability or inventory accumulation. The relative cost of these errors will vary across products and operating environments, making it important to evaluate alert performance against the consequences of the events being monitored.
Timing is another essential consideration, particularly when replenishment lead times limit the actions available after a warning has been issued. An alert that correctly identifies an approaching stockout may still offer little operational benefit if the relevant ordering deadline has already passed.
For this reason, a retailer assessing predictive inventory alerts could examine precision and recall against subsequent inventory events, the useful lead time provided by warnings and the amount of work generated for planning teams. Comparing these measures with existing monitoring procedures would help establish whether the new approach improves how planners identify and investigate potential problems.
The September 2026 study provides an empirical example of integrating forecasts with calibrated inventory diagnostics, but it does not demonstrate these operational outcomes through a deployed notification system. Evaluating them would be a necessary further step before treating a diagnostic framework as an established solution for inventory alert management.
Making Inventory Risk Signals Useful for Demand Planners
As retailers develop increasingly detailed demand forecasts, the ability to interpret their operational significance becomes an important part of planning. Forecasting models can describe how demand may evolve, while inventory indicators and historically calibrated thresholds can help reveal conditions that deserve closer examination.
The research by Huan and Sarvghadi demonstrates one way to connect these elements through a diagnostic framework, providing inventory health classifications that make predictive outputs more interpretable. Whether those classifications should lead to individual alerts, and under which conditions, remains a separate question that depends on the reliability of the signals and the needs of the planning process.
For demand planning teams, the objective is not to turn every unusual forecast into another notification, but to develop a clearer understanding of which changes could become operationally significant and how early those changes can be recognized.
The value of predictive inventory alerts ultimately depends on whether they help planners identify meaningful risks at a point when that information can still influence a decision.