
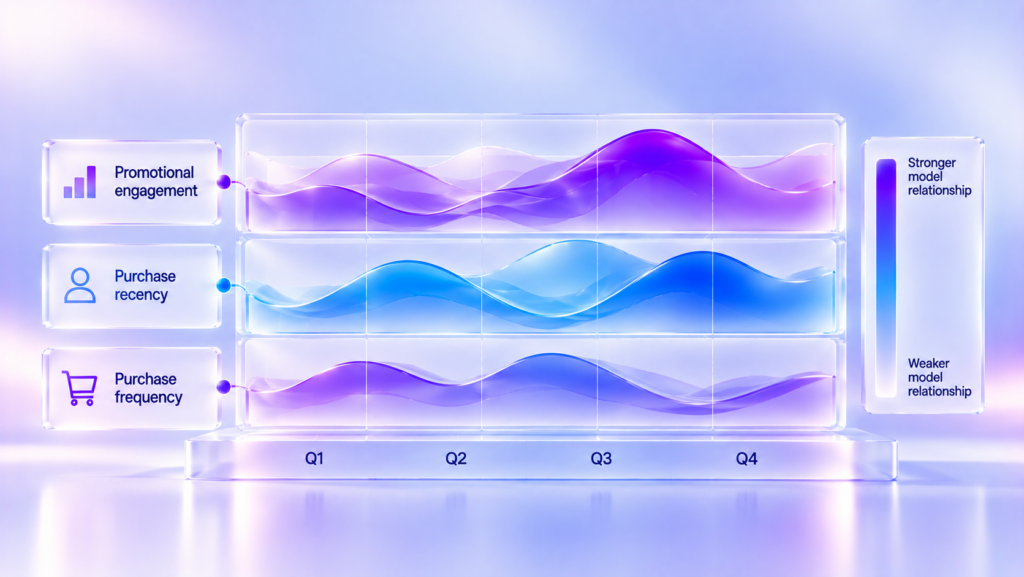
A predictive model may continue producing plausible scores even after the relationships that once made those scores useful have weakened. Conventional monitoring can flag changes in inputs or performance, but the alert alone rarely identifies which relationship deserves attention.
For organizations using predictions to prioritize customers, assess risk or allocate resources, that distinction matters. A deteriorating metric may call for a data correction, a closer look at a customer segment or a different modeling strategy. Retraining everything immediately could be unnecessary, or even counterproductive.
Explainable concept drift detection adds a diagnostic perspective: it helps investigate how a model represents predictive relationships, while leaving the underlying business explanation to be tested.
Concept Drift and Data Drift Are Not the Same
A predictive model learns associations between input variables and an outcome. In a purchase propensity application, those variables might include previous purchases, engagement and time since the last transaction.
Concept drift occurs when the statistical relationship between those inputs and the actual outcome changes. A signal that once indicated a high likelihood of purchase may become less informative after a change in customers’ preferences or purchasing conditions.
Data drift, often used to mean a change in input distributions, is different. A retailer might start reaching younger customers or selling in a new market, changing the data received by its model. That shift does not necessarily mean the conditional relationship between inputs and outcomes has changed.
The reverse can also happen: familiar-looking customer data may conceal an altered relationship with conversion. Stable inputs are therefore not a guarantee of stable predictions.
These distinctions matter because a distribution alert, a performance decline and confirmed concept drift do not carry the same evidence or call for the same response.
Why Performance Metrics Leave Diagnostic Questions Open
Precision, recall, calibration and other metrics can reveal whether a model meets its required standard. Which metric matters depends on the application and the consequences of different errors. Aggregate results should also be checked across relevant segments, where deterioration may be concentrated.
But performance measurement describes an outcome, not necessarily its cause. A decline in purchase prediction quality could reflect changes in customer behavior, a new promotional policy or a problem in how engagement data is collected.
There is also a timing problem. If a model predicts purchases within the next 90 days, its latest predictions cannot immediately be matched with complete outcomes. During that gap, input checks and model explanations may provide early clues, but they cannot establish a change in the true relationship between features and purchases.
This is why diagnostic methods can complement, rather than replace, routine monitoring. For an overview of those broader controls, see AI Model Monitoring: What to Track After Deployment.
What Profile Drift Detection Adds
In the 2026 Future Generation Computer Systems study From XAI to MLOps: Explainable Concept Drift Detection with the Partial Dependence Profiles-Based Approach, Ugur Dar and Mustafa Cavus introduce Profile Drift Detection (PDD).
The approach draws on Partial Dependence Profiles, an Explainable AI method that summarizes how predictions from a fitted model vary as one feature changes, averaging across a reference set of observations. For example, a profile might show how predicted purchasing probability varies with the number of days since a customer’s last order. Instead of reporting only a feature’s average importance, it shows the shape of the modeled association over a range of values.
PDD uses comparisons of these profiles to identify potential changes that conventional distribution or performance measures may not explain. The authors evaluate the methodology on synthetic and real-world data, reporting promising performance under their experimental conditions.
This is a methodological contribution, not evidence of improved sales or other business outcomes. Its value is the possibility of obtaining a more interpretable signal about where a predictive system may be behaving differently.
Importantly, a changed profile is not, by itself, proof of concept drift. The interpretation depends on the model, the reference observations and how the comparison is constructed. Different populations or feature correlations can affect partial dependence estimates, even without a genuine change in the relationship between inputs and observed outcomes.
An Example: When Engagement Stops Predicting Purchases
Consider a retailer that uses transaction history and campaign engagement to estimate purchase propensity. During validation, customers who interact frequently with promotional messages tend to receive higher predicted probabilities of purchase.
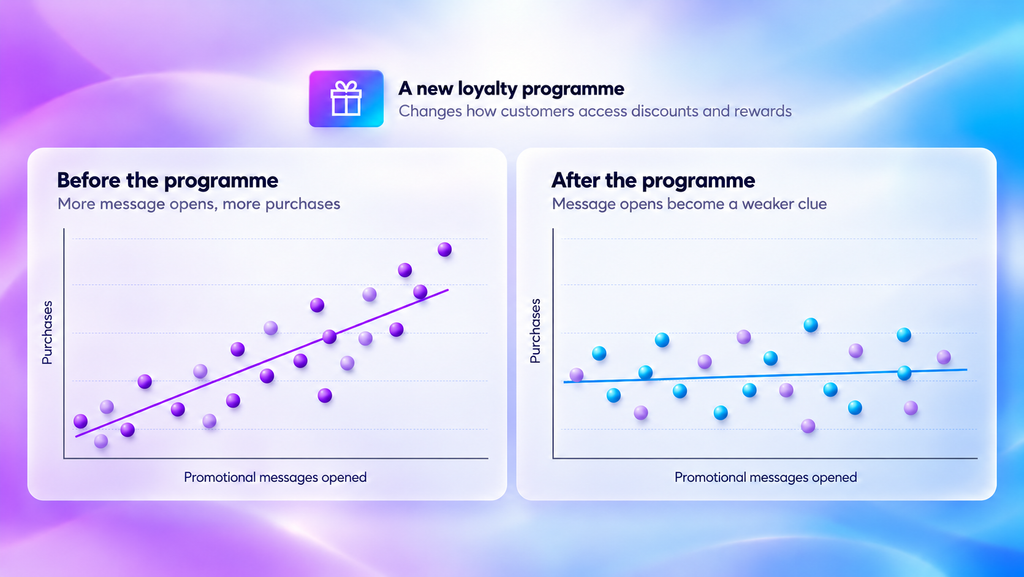
The retailer then introduces a loyalty program that changes how discounts and benefits are delivered. Customers may continue opening the same number of messages, while those interactions become less informative about whether they will buy.
A comparison of carefully constructed model profiles could reveal that the modeled association between engagement and predicted purchases differs across periods or model versions. That finding would point the team toward a specific question: does engagement still predict purchasing behavior in the same way?
The next step is to examine confirmed outcomes, ideally across comparable time windows and customer groups. If the relationship has weakened primarily among loyalty members, segment-level validation may be more informative than treating the entire customer population as one group.
This example is hypothetical. It illustrates how an explainability signal can narrow an investigation without showing that the loyalty program caused the change or that a particular detection method was deployed in a real retailer.
Explanation Is Not a Causal Diagnosis
Partial Dependence Profiles describe properties of a predictive model, not the effects of intervening on a business variable. A flatter engagement curve does not establish that a promotional strategy reduced purchase intent.
The model could have changed, the evaluated population could differ, or a correlated variable might now carry part of the same predictive information. PDP calculations may also consider feature combinations that are uncommon in practice, which can make the resulting curve harder to interpret.
Consequently, meaningful comparisons require consistency in the reference population, model versions and feature definitions. Teams should investigate data quality and confirm predictive changes against outcomes when they become available.
Where the question is causal—whether a new program actually changed customer purchasing—controlled experimentation or an appropriate causal research design is needed. Explainable drift analysis can guide what to examine; it cannot replace that evidence.
Turning a Drift Signal into a Decision
An effective investigation begins with the data pipeline. Teams should check whether features are collected consistently and whether missing values, schema changes or new transformations explain the signal.
If the data is sound, they can test whether the suspected change is concentrated in particular segments, products, regions or channels. Commercial teams may then provide context about pricing, campaigns and customer behavior that a model cannot infer reliably from its own explanations.
Finally, analysts should compare predictions with confirmed outcomes using consistent evaluation windows, distinguishing model instability from expected fluctuations or changes in population mix.
The response depends on that evidence. Some situations justify retraining or comparing alternative models; others require repairing a data process, revisiting operating thresholds or monitoring a segment more closely. Automatic retraining after every alert can reproduce a data problem instead of resolving it.
Explainability is useful when it helps a team choose a better investigation and a proportionate response, not when it merely adds another dashboard metric.
Better Diagnosis, More Reliable Decisions
Concept drift matters because a model can remain operational while losing relevance to the environment in which its predictions are used. Performance monitoring tells teams when to investigate; explainable methods may help them determine where to look.
Profile Drift Detection offers one research-backed approach to making that investigation more interpretable. Its signals must still be validated, and model explanations should not be mistaken for causal proof.
For businesses, the goal is practical: identify meaningful changes, understand their implications and update predictive systems only when the evidence supports doing so.